Acoustics Information
Intro | | Outdoor Sound Propagation | Wind Turbine Sound | Noise Impact and Regulation
Sound and Decibels
Sound is produced by many different sources that generate pressure fluctuations in air that the human ear often has the capability to detect as audible. Sound can also travel through other media such as water or structural components of a building. The types of sounds that humans experience every day can generally be divided into two categories, natural and man-made sounds.
There are many types of natural sounds that can be heard by humans. The most common of these are wildlife (e.g. birds, frogs and insects), sounds generated by the forces of wind acting on terrain and vegetation, and sounds generated by water action such as ocean waves, river flow and rain. There are also many man-made sounds generated by industrial, transportation and construction sources as well as sounds generated for the purposes of enjoyment such as music. Residential sounds are also common in many areas and include recreation, yard maintenance, human voices, and amplified music.
The magnitude or loudness of sound waves is measured in units of pressure (pascals) that yield large numbers that are difficult to interpret. For simplicity, the decibel unit or dB was developed to quantify sound pressure levels to reduce the range of numbers. The dB unit represents a ratio of the sound pressure to a standard pressure, usually 20 micropascals. This is a logarithmic ratio similar to the Richter scale for earthquakes so that a small change in sound level expressed in dB represents a larger change in the sound pressure. For example, a 10 dB change in sound level is a tenfold increase in sound pressure. However, this does not mean that the sound is perceived as ten times as loud. A change in sound levels of 3 dB is a doubling of the sound pressure but is considered to be the minimum change that is perceptible to human hearing. A change of 5 dB becomes quite noticeable and an increase of 10 dB is perceived as twice as loud.
The frequency or pitch of sound is expressed in Hertz (Hz) and is the number of sound waves passing a specific point each second, i.e. cycles per second. Frequencies generally considered audible to the human ear range from 20 to 20,000 Hz. Within this range, there are octaves that represent a band of frequencies for purposes of characterizing sound and predicting sound propagation and attenuation. Standard whole octave bands are centered around 31.5 Hz, 63 Hz, 125 Hz, 250 Hz, 500 Hz, 1000 Hz, 2000 Hz, 4000 Hz and 8000 Hz. Octave bands can be further divided (typically third octaves) and used to determine if a sound source generates an audible pure tone such as a whistle or hum that may be more perceptible than a broad mixture of frequencies. Low frequency sound is generally considered to be at frequencies of 200 Hz and below. Within this range, infrasound has frequencies below 20 Hz and is not usually considered audible to humans except at very high decibel levels.
Sound levels in frequencies ranging from 500 to 2500 Hz are more audible to humans compared with frequencies below 100 Hz. Consequently, the A-weighting scale was developed to measure sound levels in units of dBA to simulate the hearing response of humans. Under this weighting system, the sound pressure level at low frequencies is reduced based on its audibility to humans. The linear (no weighting) and C-weighting scales are often used to determine the relative contribution of low frequency sounds during a sound measurement. These low frequency sounds may not be audible to humans hence the use and wide acceptance of the A-weighting network. Figure 1 provides a graph that shows the reduction by frequency for A- and C-weighting scales.
Sound level measurements are also time-weighted to represent certain parameters or timeframes of interest or identify short duration events. The most common time weightings are “Fast” and “Slow”. Fast-time weighting is based on 1/8-second intervals and is useful for determining rapid changes in sound levels. The slow-time weighting integrates the measured sound levels over a one-second period that reduces the rapid fluctuations for ease of observation.
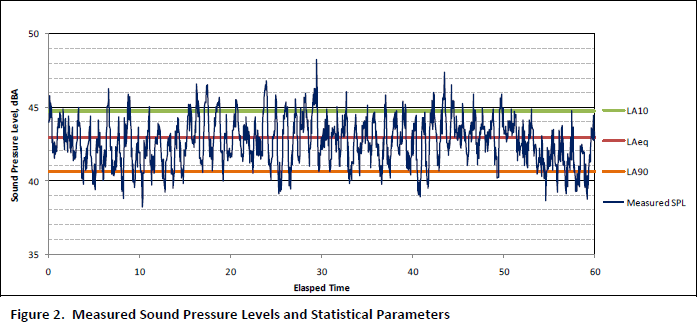
Similar to size and period of ocean waves, sound waves can vary considerably in amplitude and frequency. When using a fast-time weighting, a sound level meter will measure a sound pressure level every 1/8 of second which results in 480 measurements each minute and 28,800 measurements in an hour. Because it would be nearly impossible to evaluate over 28,000 measurements per hour, numerous statistical parameters have been developed for use in quantifying long-term sound level measurements. The most common is the A-weighted equivalent sound level or LAeq, which represents the time-varying sound level as a single dBA level by effectively spreading the sound energy across the entire measurement period. Other common parameters are percentile levels that represent the percentage of time that a specific sound level was exceeded. For example, the LA10 provides the sound level that was exceeded 10% of the time during the measurement period. This means that 10% of the measured sound levels were higher and 90% were lower than the measured LA10. Other commonly used percentiles include the LA50 or median sound level and the LA90 for which 90% of the measured sound levels are higher. The LA90 is often referred to as the background sound level as it eliminates most fluctuations from short term sound events such as aircraft flights and wind gusts. Figure 2 presents a graph that shows the measured sound pressure levels and the resulting equivalent (LAeq), LA10 and LA90 sound level parameters.

For purposes of quantifying industrial and other man-made sound sources, the term “sound power level” is used. The unit of sound power level is watts and the term is commonly expressed as Lw. When applied to sound power, the dB unit represents a logarithmic ratio of the source sound power to a reference sound power (10-12 watt). Sound power levels are determined by measuring the sound pressure level from a source at a specific distance and calculating the sound attenuation between the source and measurement location. This provides a mechanism for ranking and quantifying noise sources, such as wind turbines, in a consistent and standardized manner. The sound power level cannot be measured directly and can be a source of confusion to the public in understanding the sound pressure levels that will result at community locations.
The combination of all existing sound sources, natural and man-made, at a specific location or in a community, is known as the ambient sound environment or soundscape. The amplitude and characteristics of the soundscape vary significantly depending on the amount of industrial and residential development, proximity to transportation uses such as highways and airports, and the presence of natural sounds such as wind, flowing water, and wildlife. In general, the more rural or undeveloped an area is, the lower the ambient sound levels will be. Ambient sound levels are usually higher during daytime hours than at night due to more traffic and human activity, higher wind speeds and other natural sounds during the day. At night, these daytime sources typically diminish and sound levels are reduced with the exception of strong winds or rain occurring during the overnight period.
Noise is generally defined as unwanted sound. The perception of noise as an unwanted sound can vary significantly by individual and preferences concerning types of sound. A simple example of this is music. One person may enjoy a certain type of music that another may find extremely annoying. Some individuals find enjoyment and solitude in listening to natural sounds or the nighttime quiet of a rural area while others have little interest in such soundscapes.
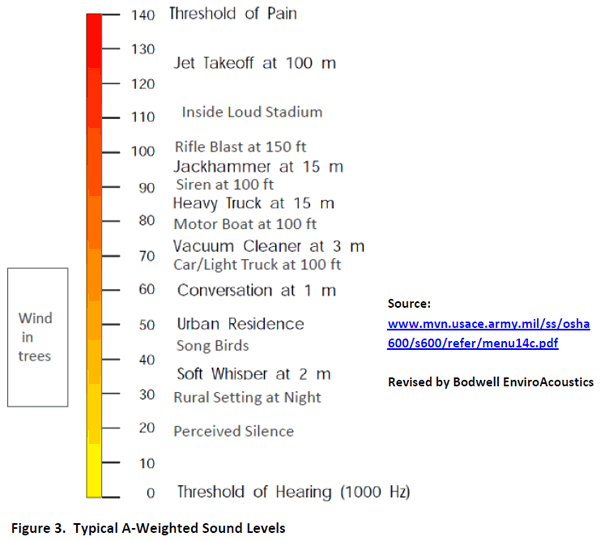
The character of sound is determined by its loudness or amplitude and its pitch or frequency. Humans can detect a wide range of sound level amplitudes and frequencies as audible but are more sensitive to a specific range of frequencies. Consequently, the perceived loudness of sound also depends not only on its amplitude but on its frequency characteristics as well. For example, the sound of birds, frogs or flowing water is often perceived as quieter than man-made sounds at the same amplitude. The sound levels associated with some common noise sources and sound environments is presented as Figure 3.

|

